Statistical Analysis with R for Research (SAR09)
Center for Health Innovation, Research, Action and Learning – Bangladesh
🗓March 7 & 8, 2025 – February 28, 2025 | 9:00am - 10:30pm (Bangladesh Time)
📢 If you are interested in joinin this course, please follow the instructions below:
📌 Register with Google Forms
📝 Course Content and Timeline View in Google Sheet
Course overview
Welcome to the Statistical Analysis with R for Research! This intensive program is designed to equip researchers, students, and professionals with essential R programming skills for statistical analysis. Whether you are new to R or looking to enhance your skills, this course offers a hands-on experience to help you confidently analyze and interpret data for research purposes.
Learning outcomes
During this workshop, participants will:
- Understand the fundamentals of R programming.
- Learn data manipulation techniques using R.
- Perform descriptive and inferential statistical analyses.
- Create effective visualizations for data interpretation.
- Apply R in research-specific scenarios.
The course will involve practical exercises, real-world examples, and guidance from experienced instructors to ensure you walk away with practical, applicable knowledge.
Who should attend?
This course is designed for anyone interested in research and data analysis, regardless of background or experience. Whether you’re a beginner or looking to refine your skills in R, this course will provide valuable insights. Ideal participants include:
- Undergraduate, graduate, and PhD students conducting research.
- Faculty members, industry professionals, and analysts working with data.
- Anyone eager to learn statistical analysis and R programming for research.
No prior programming experience is required, but basic knowledge of statistics will be helpful.
Why join this course?
- Gain hands-on experience in statistical analysis using R, a powerful tool for research and data science.
- Tailored for students, academicians, and professionals who need practical statistical skills for research and publication.
- Get guidance from experienced instructors with expertise in R, biostatistics, and research methodologies.
- Work with real-world datasets, conduct statistical tests, and visualize results effectively.
- Strengthen your analytical skills, making you a competitive candidate for research roles and data-driven careers.
- Access sample recordings, interactive sessions, and structured content to learn at your own pace.
By participating in this course, you will not only gain valuable analytical skills but also expand your professional network and enhance your ability to make data-driven decisions in your research field.
What is R?
R is an open source language and environment for statistical computing, data mining, modeling, and data graphics. It provides a wide variety of statistical and graphical techniques such as linear and non-linear modeling, statistical tests, time series analysis, classification, and clustering.
Why R?
- R is a programming and statistical language.
- R is used for data Analysis and Visualization.
- R is simple and easy to learn, read and write.
- R is an example of a FLOSS (Free Libre and Open Source Software) where one can freely distribute copies of this software, read its source code, modify it, etc.
Course Modules
Module 1
Fundamentals of R
This module covers the basics of R, including installation, environment setup, and core programming concepts. Learners will explore variables, data types, operators, conditional logic, loops, and essential data structures like vectors, factors, matrices, data frames, and lists—building a strong foundation for data analysis in R.
Module 2
Statistics for Researchers
This module introduces fundamental statistical concepts essential for research. It covers descriptive statistics, probability distributions, hypothesis testing, correlation, regression analysis, and statistical inference. Learners will apply these techniques using R, gaining practical skills for data-driven research and decision-making.
Module 3
Data Wrangling with R
This module focuses on data manipulation techniques essential for preparing and cleaning datasets. It covers data import/export, filtering, sorting, transforming, and reshaping using R’s powerful packages like dplyr and tidyr. Learners will develop hands-on skills to handle real-world data efficiently.
Module 4
Publication-ready and Reproducible Tables with R
This module focuses on creating high-quality, reproducible tables for research and publication using gtsummary and gt. Learners will explore techniques for summarizing data, formatting tables, and enhancing readability to meet journal and reporting standards.
Module 5
Publication-ready Data Visualization with R
This module covers the principles of effective data visualization for research and publication. Using ggplot2, learners will create high-quality graphs, customize aesthetics, and ensure clarity, reproducibility, and compliance with scientific reporting standards.
Module 6
Reproducing a Scientific Article: A Practical Application
This module guides learners through the process of replicating a published scientific study using R. It covers data extraction, statistical analysis, visualization, and table generation to ensure reproducibility. By applying learned skills, participants will strengthen their ability to conduct transparent and replicable research.
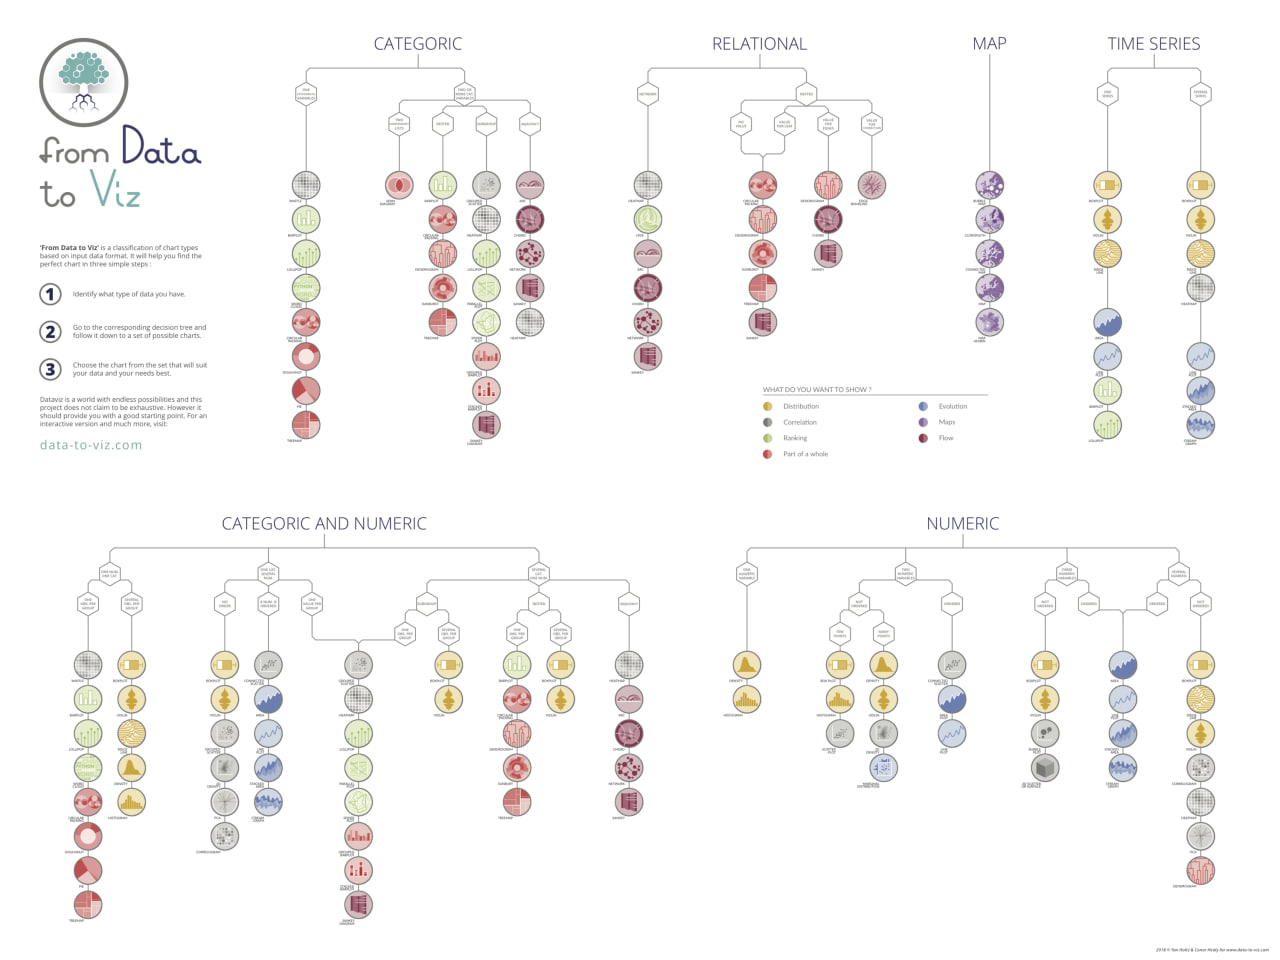
Data Visualization Decision Tree
To choose the best type of visualization for your data, start by identifying the main type of data you have. Use the options below to select your data category. Then, follow the decision tree to explore various graphical representations that effectively communicate your insights. Whether you’re working with categorical, numerical, time-series, or spatial data, this guide will help you find the most suitable visualization method for clear and impactful storytelling.
Publication-ready figures
The ggpubr package provides some easy-to-use functions for creating and customizing ‘ggplot2’- based publication ready plots. ggplot2, by Hadley Wickham, is an excellent and flexible package for elegant data visualization in R. However the default generated plots requires some formatting before we can send them for publication. Furthermore, to customize a ggplot, the syntax is opaque and this raises the level of difficulty for researchers with no advanced R programming skills.

Publication-ready tables
The gtsummary package provides an elegant and flexible way to create publication-ready analytical and summary tables using the R programming language. The {gtsummary} package summarizes data sets, regression models, and more, using sensible defaults with highly customizable capabilities.
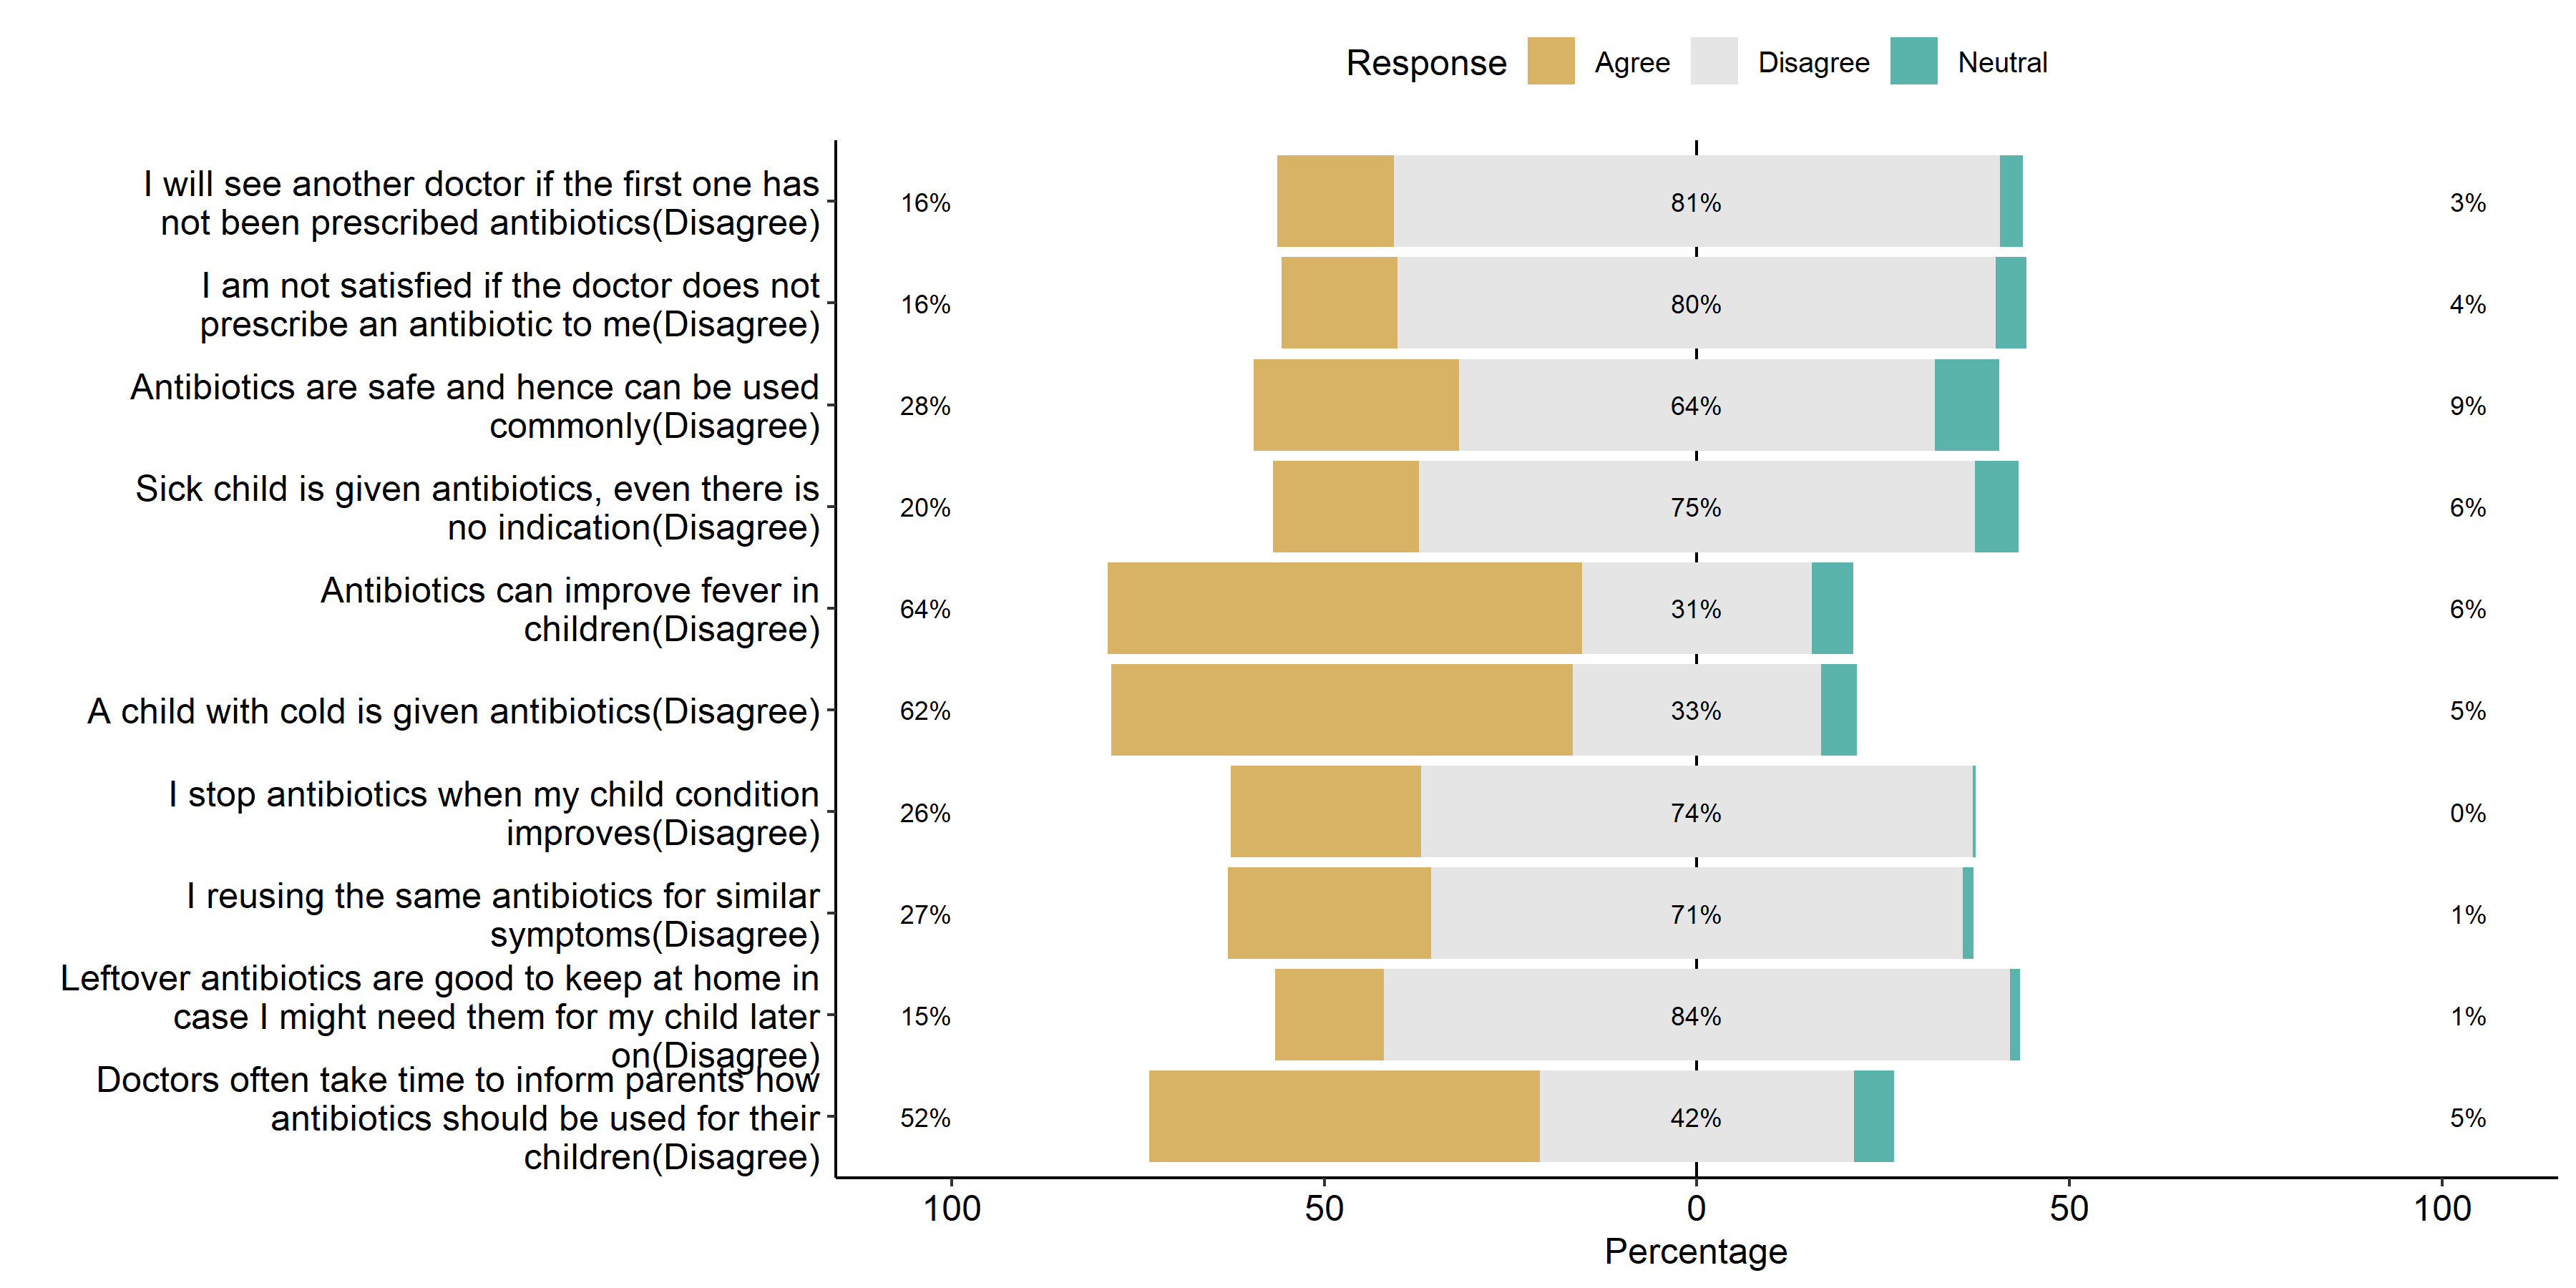
Analysis and visualization likert items
The likert is an R package designed to help analyzing and visualizing Likert type items. It has been developped by Jason Bryer and Kim Speerschneider. This barplot comes from the demo page and has been sent by Carlos Ortega. It allows to analyse the reading attitudes from a panel of people.
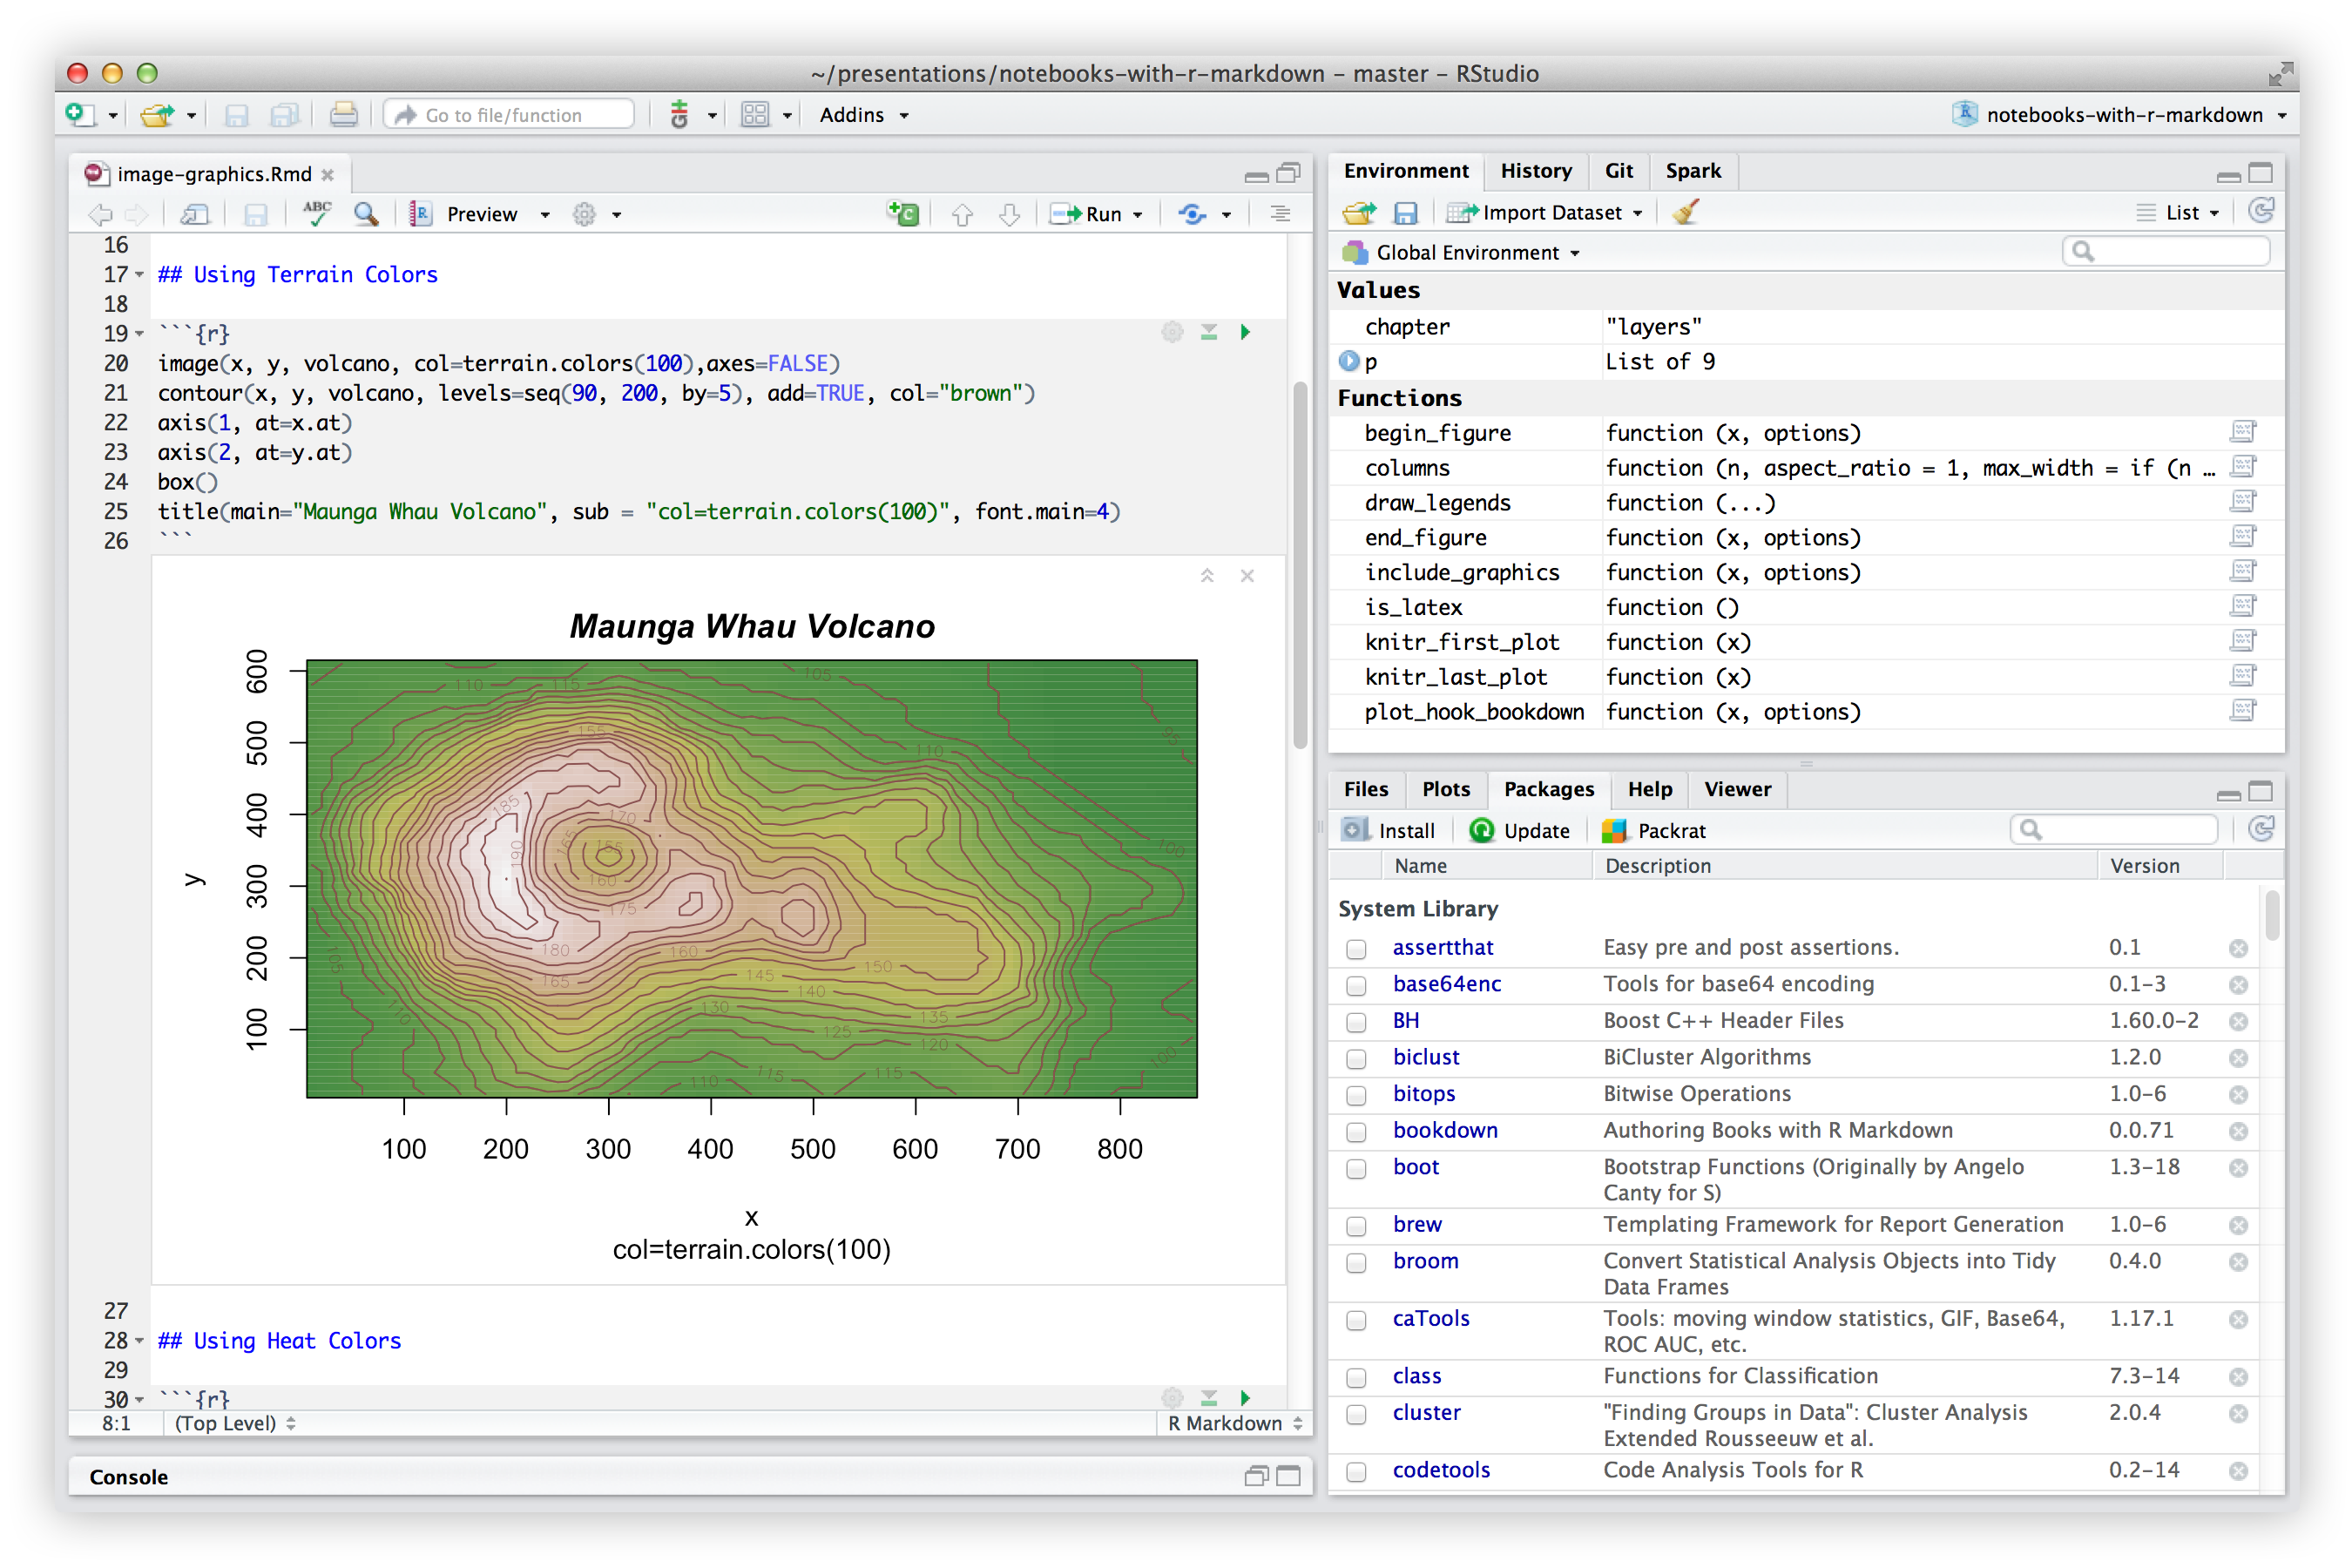
Reproducible academic writing with Rmarkdown/Quarto
R Markdown documents are fully reproducible. Use a productive notebook interface to weave together narrative text and code to produce elegantly formatted output. Use multiple languages including R, Python, and SQL.
Required software
- R: http://www.r-project.org/ (FREE)
- RStudio (additional libraries required): http://www.rstudio.com/ (FREE)
Core packages
In R, several core packages provide essential tools for data manipulation, visualization, and analysis. These packages form the foundation of the R ecosystem, enabling efficient workflows and reproducible research.

The dplyr package in R provides a concise grammar of data manipulation, offering consistent verbs for common tasks. Key functions include select() to extract columns, filter() to subset rows, mutate() to create or modify variables, arrange() to sort rows, and summarize() with group_by() for grouped aggregations. Additionally, rename() simplifies column renaming. These tools streamline data transformation, making workflows efficient and readable for modern data analysis in R.
The ggplot2 package in R is a powerful tool for data visualization, based on the grammar of graphics. It allows users to build plots layer by layer, starting with data and aesthetic mappings defined in ggplot(). Key layers include geom_ functions for adding geometric elements (e.g., geom_point() for scatterplots, geom_bar() for bar charts), facet_ functions for creating subplots, and theme() for customizing appearances. Its flexibility in mapping data to visual elements, combined with a rich set of options for customization, makes ggplot2 a cornerstone of exploratory and presentation-ready visualizations.

The tidyr package in R is designed for tidying data, ensuring it is in a consistent, tidy format where each variable is a column and each observation is a row. Key functions include pivot_longer() to convert wide data into long format, pivot_wider() for the reverse transformation, separate() to split a single column into multiple, and unite() to combine multiple columns into one. These functions enable efficient reshaping and restructuring of data, facilitating better data analysis and preparation for modeling or visualization tasks.

The readr package in R provides fast and efficient functions for reading and writing data. It simplifies importing data from various file formats, such as CSV, TSV, and fixed-width files, with functions like read_csv(), read_tsv(), and read_fwf(). These functions automatically handle common data issues such as type conversion and missing values. Additionally, readr provides write_csv() and write_tsv() for exporting data, ensuring compatibility with other tools while maintaining efficiency and consistency in data import/export tasks.
The stringr package in R provides a set of consistent and user-friendly functions for string manipulation. It simplifies common tasks such as detecting patterns with str_detect(), extracting substrings with str_extract(), and replacing text with str_replace(). Additionally, stringr offers functions like str_sub() for substring extraction, str_length() for string length, and str_c() for concatenating strings. These functions help streamline text processing, ensuring consistency and efficiency when working with string data.

The forcats package in R is designed for working with categorical data, specifically factors. It provides functions for reordering, recoding, and combining factor levels in a straightforward way. Key functions include fct_reorder() to reorder factor levels based on another variable, fct_lump() to combine infrequent levels, fct_recode() for renaming factor levels, and fct_drop() to remove unused levels. forcats helps manage and manipulate factors effectively, ensuring clean and meaningful categorical data for analysis and visualization.
The easystats package in R is a collection of tools designed to simplify the process of statistical analysis, reporting, and visualization. It provides a unified interface for working with various statistical models and outputs, making it easier to interpret and communicate results. Key functions include parameters() for extracting model parameters, performance() for assessing model fit, and effectsize() for calculating effect sizes. Additionally, easystats offers functions for model comparisons, diagnostics, and visualizations, streamlining the workflow for both beginners and advanced users in statistical analysis.
The gtsummary package in R is designed for creating publication-ready summary tables from statistical models and data. It allows users to easily summarize data, describe statistics, and present results in a clear, formatted table. Key functions include tbl_summary() for descriptive statistics of datasets, tbl_regression() for summarizing regression model results, and tbl_uvregression() for univariate regression analyses. The package supports customization of table styles, variable transformations, and statistical tests, making it a valuable tool for producing professional reports and visual summaries in clinical and social science research.
The gt package in R is used for creating beautiful, customizable tables for data presentation. It allows users to easily create tables from data frames or tibbles with functions like gt() to initiate the table and tab_spanner() for grouping columns. Users can apply various formatting options, such as color, bold, and font styles, to enhance the table’s readability using functions like tab_style() and tab_footnote(). gt also supports features like adding summary statistics, row/column grouping, and rendering tables in HTML or LaTeX for use in reports and publications.

Quarto is an open-source, next-generation publishing system that enables users to create dynamic documents, reports, presentations, and websites. It supports a wide range of formats, including HTML, PDF, Word, and slides, and integrates seamlessly with R, Python, Julia, and Observable. Quarto allows for literate programming, where code and narrative are combined in a single document. It supports advanced features like interactive visualizations, cross-referencing, and citation management, making it an ideal tool for academic and technical writing, data analysis, and reproducible research.
Recording of classes
Class lectures will be recorded automatically using cloud. The links will be posted to CHIRAL Classes when they are available.
Prework
Before attending the workshop please have the following installed and configured on your machine.
Recent version of R
Recent version of RStudio
Most recent release of the gtsummary and other packages used in workshop.
Installation and use
To install a package in R, use the
install.packages(tidyverse)function. This function downloads and installs the specified package from CRAN (Comprehensive R Archive Network) or other repositories.-
Run
library(tidyverse)to load the core tidyverse and make it available in your current R session.# Define the package list install_pkgs <- c("gtsummary", "tidyverse", "gapminder", "ggpubr", "likert", "skimr", "car", "dplyr", "ggplot2", "tidyr", "readr", "stringr", "forcats", "easystats", "devtools", "gt", "quarto") # Install the packages install.packages(instll_pkgs) -
Ensure you can knit R quarto documents
- Open RStudio and create a new quarto document
- Save the document and check you are able to knit it.
Team
Md. Jubayer Hossain
Founder & Executive Director, CHIRAL
 Md. Jubayer Hossain is the Founder and Executive Director of CHIRAL Bangladesh. CHIRAL Bangladesh is a non-profit organization dedicated to health research to improve lives in Bangladesh. He aspires to maximize the quality of life of people around him by working at the intersection of education, technology, and biomedical research. Detailed research and teaching activities were found on his website.
Muhibullah Shahjahan
Research Assistant, Big Bioinformatics Lab, CHIRAL
 Muhibullah Shahjahan is a researcher specializing in Cancer Bioinformatics and Machine Learning. As a Research Assistant at the Big Bioinformatics Lab of CHIRAL Bangladesh, he focuses on applying computational tools to address biological research questions. With experience in statistical analysis and R programming, he contributes to advancing biomedical data science education and supports researchers in analyzing and interpreting complex datasets.
Muhammad Mohtasim Billah, Instructor
Research Assistant, Big Bioinformatics Lab, CHIRAL

Muhammad Mohtasim Billah is a researcher with a focus on Cancer Bioinformatics. Affiliated with the Big Bioinformatics Lab at CHIRAL Bangladesh, he applies computational approaches to study cancer biology and support data-driven research. His work involves statistical analysis and bioinformatics techniques, contributing to the understanding and management of complex biological data.
Sajjad Hossain, Instructor
Research Assistant, Big Bioinformatics Lab, CHIRAL

Sajjad Hossen is a researcher with expertise in Cancer Bioinformatics and serves as an instructor at the Big Bioinformatics Lab, CHIRAL Bangladesh. In addition to his research endeavors, he is responsible for managing and coordinating the lab’s training programs, fostering the dissemination of advanced bioinformatics knowledge. His work focuses on computational analysis and the interpretation of complex biological datasets, contributing to capacity-building efforts and the advancement of biomedical research.
Muntasim Fuad, Instructor
Research Assistant, Big Bioinformatics Lab, CHIRAL
Muntasim Fuad is a researcher specializing in Cancer Bioinformatics. As a Research Assistant Instructor at the Big Bioinformatics Lab, CHIRAL Bangladesh, he applies computational techniques to explore complex biological data and advance cancer research. His role involves supporting research initiatives and contributing to the academic development of trainees in bioinformatics and data analysis.
Tajrian Rahman
Training Manager, Training Unit, CHIRAL
 Tajrian Rahman is the Training Manager at CHIRAL Bangladesh, where she is responsible for overseeing the planning, execution, and management of training programs at the CHIRAL. Her work involves designing educational initiatives that enhance bioinformatics skills and support the professional development of researchers and students. Through her role, she contributes to strengthening the CHIRAL’s capacity-building efforts and advancing knowledge in biomedical data science.
Past Cohort Recordings
Get a glimpse into our Statistical Analysis with R for Research course through these selected sample recordings from previous batches. These videos showcase the teaching style, practical demonstrations, and key topics covered in the course. Explore them to see how this course can enhance your research skills and data analysis proficiency using R.